DISEÑO Y ANÁLISIS DE CIRCUITOS BASADOS EN INTERNET
Sophisticated Presentation of Simulation Results
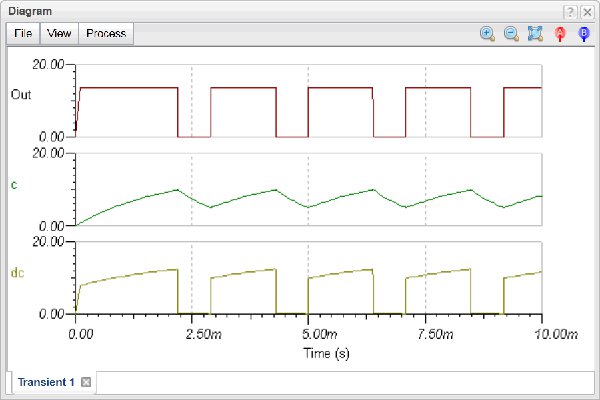
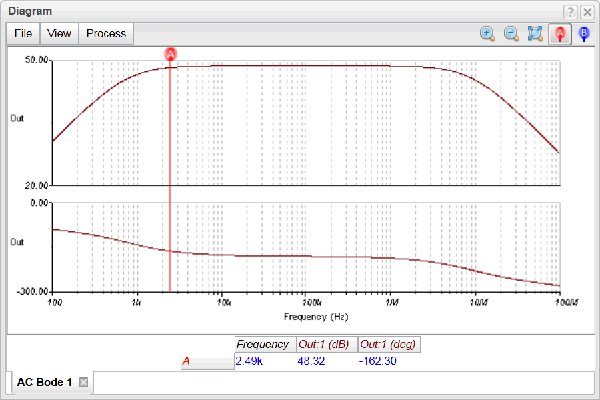
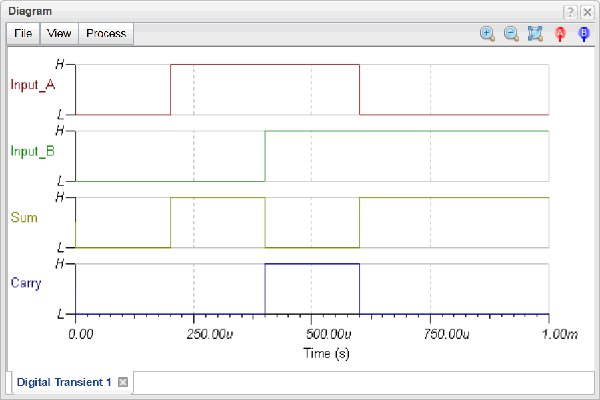
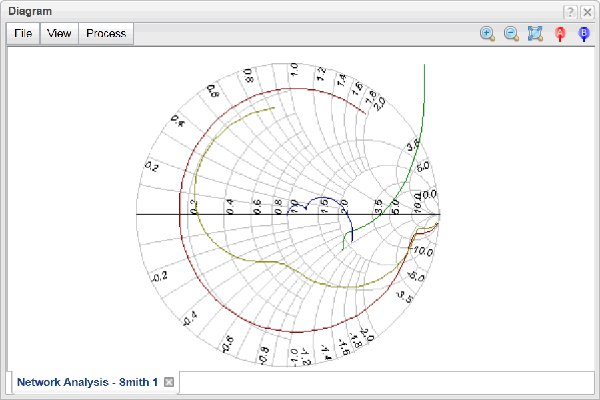
Diagram Editor With TINA you can make stand-out presentations of Bode plots, Nyquist diagrams, transient responses, digital waveforms and other data using linear or logarithmic scales. Customize presentations easily using TINA's advanced drawing tools-you can print your plots directly from TINA, cut and paste them into your favorite word processing package, or export them to popular standard formats. Customization includes complete control over texts, axes, and plot style; e.g., setting line width and color, fonts in all sizes and color, and automatic or manual scaling for each axis.


